

Navigating the complex world of forex trading can be challenging, but technical indicators offer valuable insights into price movements. These tools help traders identify trends, assess market conditions (like overbought or oversold situations), and gauge volatility. From simple moving averages to more advanced systems like the Ichimoku Cloud, indicators are a vital part of any trader’s toolkit.
Why Are Technical Indicators So Popular?
Technical indicators provide concrete entry and exit points, allowing traders to make decisions based on data rather than emotion. This is particularly helpful for those struggling with the discretion involved in fundamental analysis. Many fundamental traders even use technical analysis to pinpoint the ideal price levels to enter or close a trade.
Let’s explore five of the most effective technical indicators used by forex traders worldwide:
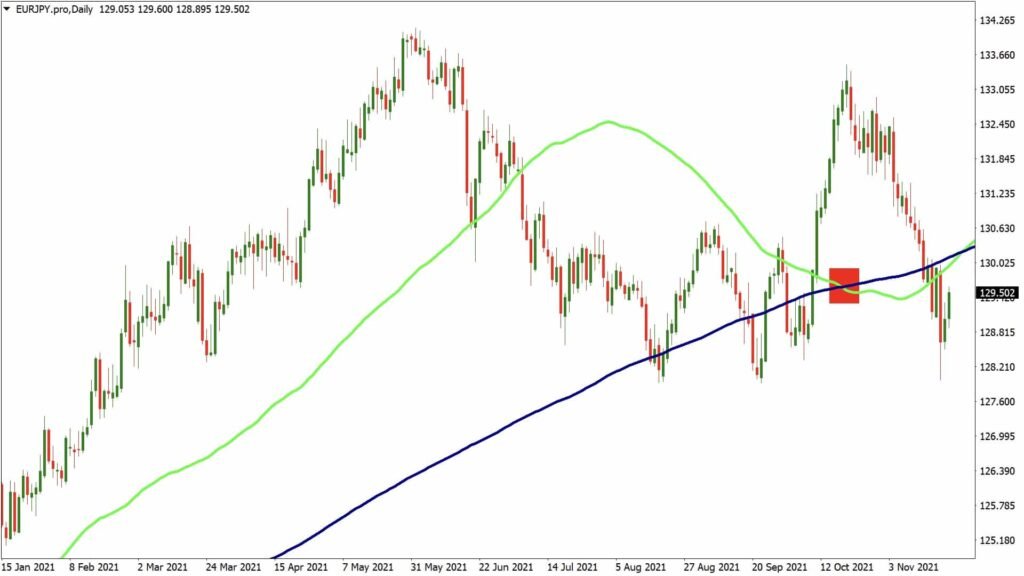
1. Moving Averages: Spotting Trends
Moving averages are a cornerstone of technical analysis, used to smooth out price fluctuations and reveal underlying trends. A short-term moving average crossing above a long-term average can signal a potential uptrend, while a crossover in the opposite direction may indicate a downtrend. They are also useful for identifying possible trend reversals.
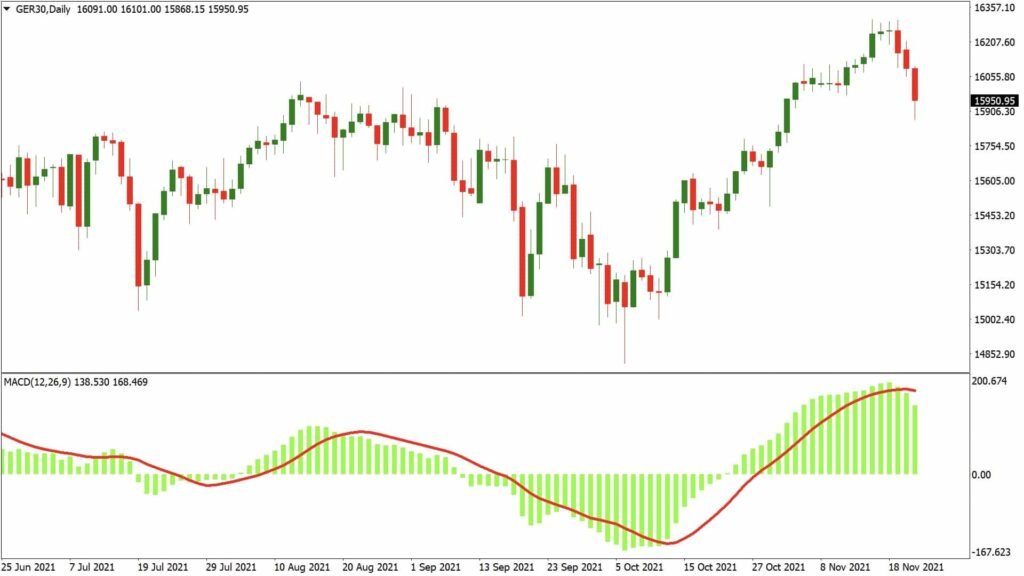
2. MACD (Moving Average Convergence Divergence): Catching Momentum Shifts
The MACD consists of three key components: the MACD line (the difference between two moving averages), the signal line (a moving average of the MACD line), and the histogram (visually representing the gap between the MACD and signal lines). The faster MACD line reacts quickly to price movements. When the MACD line crosses the signal line, it often suggests the start of a new trend or a shift in momentum.
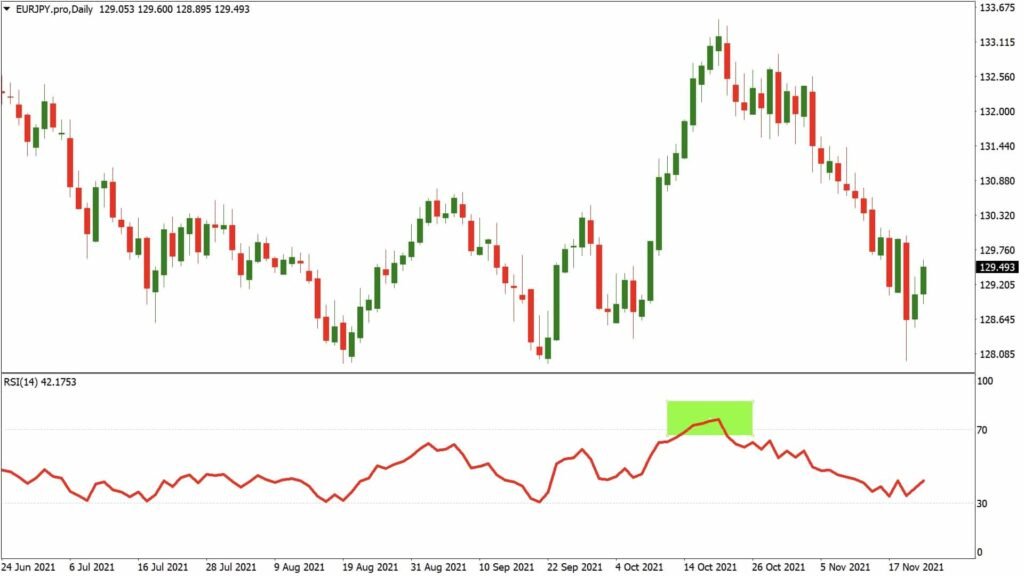
3. RSI (Relative Strength Indicator): Identifying Overbought/Oversold Conditions
The RSI is an oscillator that measures the speed and change of price movements. It oscillates between 0 and 100. An RSI reading below 30 typically indicates an oversold condition, suggesting a possible price rebound. Conversely, an RSI above 70 signals an overbought market, often preceding a potential price decline. Traders can use the RSI to anticipate reversals or spot divergences with price action.
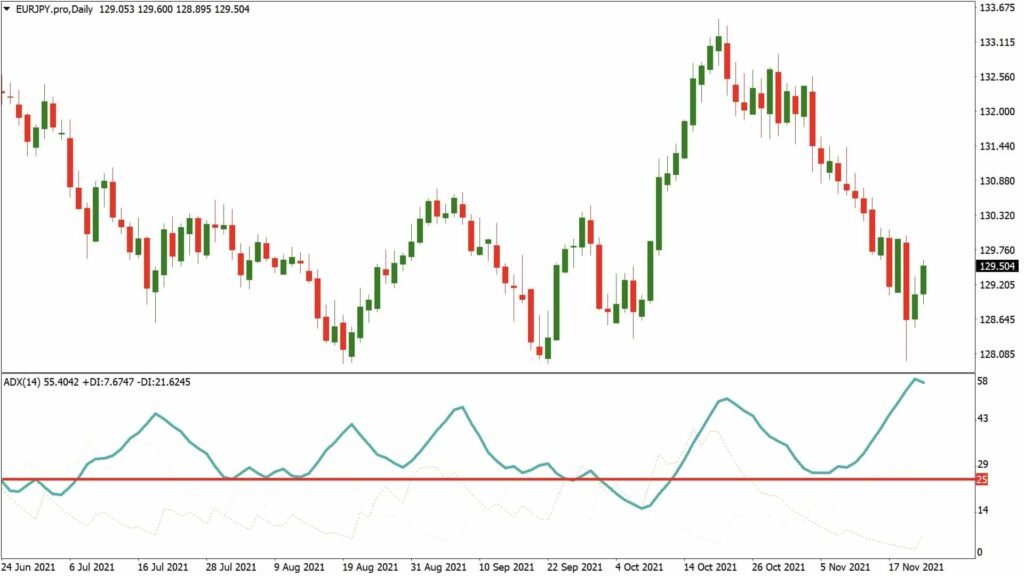
4. ADX (Average Directional Index): Gauging Trend Strength
The ADX is a trend-following indicator that measures the strength or weakness of a trend. A reading above 25 generally suggests a strong trending market. The higher the ADX, the stronger the trend. The ADX is best used in conjunction with other indicators to build robust trading strategies.
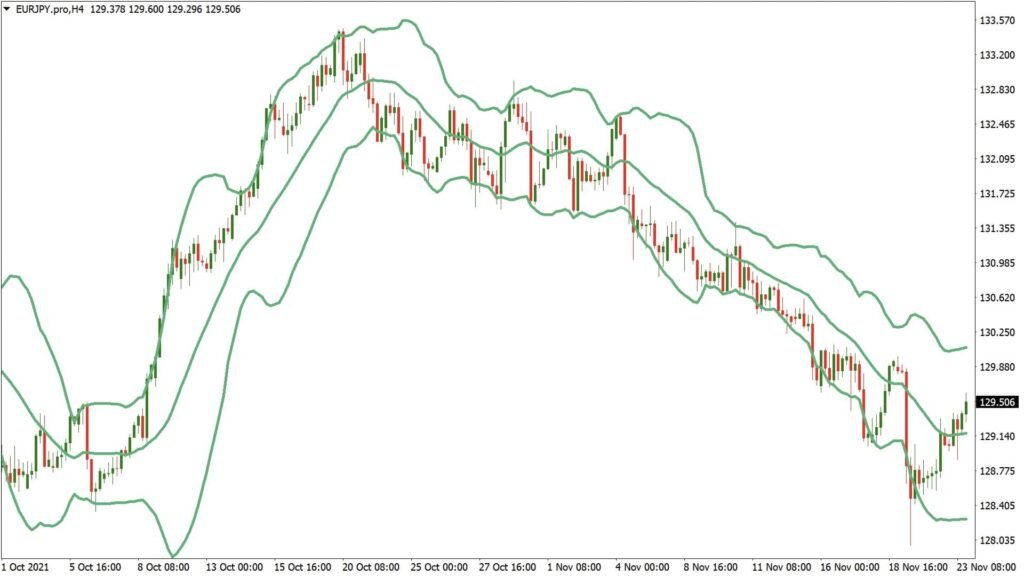
5. Bollinger Bands: Understanding Volatility
Bollinger Bands consist of an upper and lower band plotted two standard deviations away from a moving average. They help traders assess market volatility. Narrowing bands signify low volatility and potential price consolidation, while widening bands suggest increased volatility and potential price breakouts.
Key Takeaway
These five indicators are powerful tools in the forex trader’s arsenal. However, it’s important to remember that no single indicator guarantees success. Combining multiple indicators, developing a robust trading plan, and practicing disciplined risk management are crucial for navigating the forex market effectively.