

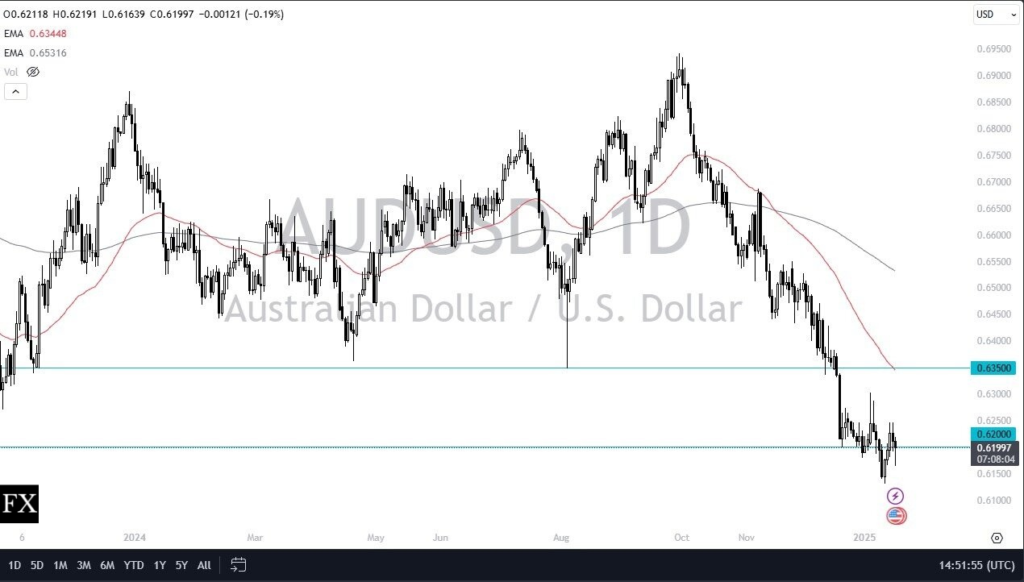
The AUD/USD currency pair has been exhibiting volatility ahead of the inauguration of Donald Trump in the United States. The pair recently dipped below the 0.6200 psychological level, briefly touching 0.6133, its lowest point this month. This movement comes amidst anticipation of the potential economic impact of new US policies.
Economic Context
Trump’s upcoming policies are expected to influence both the American and Australian economies. Key policies include:
- Tariffs: Implementation of tariffs on imported goods to the US.
- Tax Cuts: Plans to reduce taxes to benefit American businesses.
- External Revenue Service: Establishment of a department to oversee tariffs.
These policies are largely aimed at countries with significant trade deficits with the United States, such as China, Mexico, and Canada. The combined effect of tariffs and potential deportations may lead to increased inflation within the US. Recent US data indicates a rise in headline CPI from 2.7% in November to 2.9% in December. While core consumer inflation saw a slight decrease from 3.3% to 3.2%, it remains above the Federal Reserve’s 2% target. This indicates that the Federal Reserve may maintain its hawkish stance, potentially implementing up to two interest rate cuts this year.
The upcoming week’s economic calendar is light, however traders will be monitoring events at Davos, where policymakers will be delivering estimates for the year. Additionally, flash manufacturing and services PMI data from both the US and Australia will be released, and should be closely watched.
Technical Analysis and Trading Signals
Since peaking at 0.6941 in September, the AUD/USD pair has been in a downtrend, recently breaking below the 0.6360 support level and bottoming out at 0.6133 last week. It is now consolidating, as indicated by the narrowing Bollinger Bands, and trading below its 50-day moving average.
Notably, the MACD and RSI indicators have formed a bullish divergence pattern, suggesting a potential shift in momentum. This indicates that the pair, which has been in a freefall since the last US election, may see a rebound. If this occurs, the next key resistance level is at 0.6360. Conversely, a break below the year-to-date low of 0.6135 would invalidate the potential bullish scenario.
Trading Recommendations:
Based on the analysis above, there are two potential trading scenarios:
Bullish View:
- Buy the AUD/USD pair.
- Set a take-profit target at 0.6360.
- Place a stop-loss at 0.6100.
- Timeframe: 1-2 days.
Bearish View:
- Sell the AUD/USD pair.
- Set a take-profit target at 0.6100
- Place a stop-loss at 0.6250.
Ready to trade today’s AUD/USD forecast? Check out list of the top 10 Forex brokers in the world.