

The AUD/USD pair has experienced a notable overnight rally, fueled by a combination of factors, including a shift in US policy and a technical pattern formation. This presents a potential trading opportunity for both bullish and bearish scenarios.
Bullish Scenario:
- Action: Buy AUD/USD
- Take Profit: 0.6360
- Stop Loss: 0.6150
- Timeline: 1-2 days
Bearish Scenario:
- Action: Place a sell-stop order at 0.6245
- Take Profit: 0.6150
- Stop Loss: 0.6350
Driving Forces Behind the Uptick:
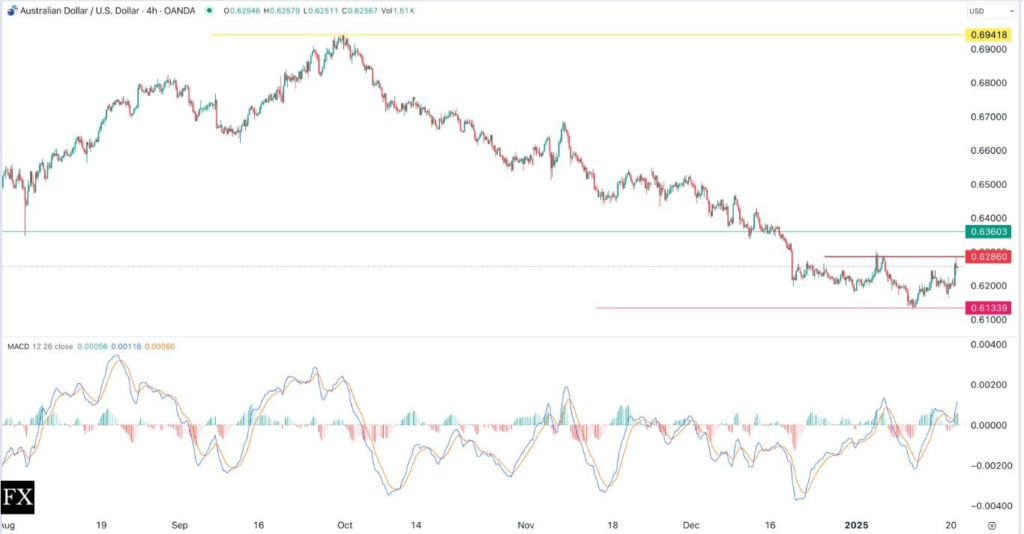
The AUD/USD surged to a high of 0.6286, the highest since January 6th, marking a 2.45% gain from its recent low. This upward movement was sparked by news of President Trump initiating a study on tariffs, signaling a less confrontational stance towards China. The reinstatement of TikTok and potential talks with Beijing also contributed to this rally.
The market appears to be reacting positively to the prospect of a trade deal between the US and China, which could benefit the Australian economy, given China is a major trading partner. Consequently, prices of key Australian exports, such as coal and iron ore, have experienced an increase.
Furthermore, the pair’s rise was supported by a weakening US dollar, evidenced by a drop of over 1% in the US dollar index (DXY) and a decrease in the 10-year yield to 4.54%.
Technical Analysis Points to Bullish Momentum:
A key development on the 4-hour chart is the formation of an inverse head and shoulders pattern. This bullish reversal pattern is characterized by a low at 0.6133 (the head) and two higher lows at 0.6180 (the shoulders).
The neckline of this pattern, currently at 0.6285, is a critical resistance level. A break above this level typically signals a continuation of the upward trend. The pair has already edged above the 50-period moving average, and the MACD indicator has crossed above its signal line, further supporting a bullish bias.
The initial target for the upward move is the 0.6360 level, which represents the August 5th swing low. A sustained break above this level could trigger a push towards 0.6400. However, traders should be aware that a move to this level could signal a potential “break and retest” scenario, which could result in a resumption of the bearish trend.
What to Watch:
With no major economic data releases scheduled for Tuesday, traders should closely monitor any statements from President Trump, as they may provide additional direction for the pair.
Key Takeaways:
- The AUD/USD has shown strong bullish momentum driven by shifting US policy and technical factors.
- The inverse head and shoulders pattern suggests a potential continuation of the upward move.
- Traders should monitor key levels, including the 0.6285 neckline and the 0.6360 target, for further confirmation.
- Be aware of the potential for a “break and retest” scenario that could lead to renewed bearish pressure.
Ready to trade today’s AUD/USD forecast? Check out list of the top 10 Forex brokers in the world.