

Overview
The GBP/USD currency pair is currently exhibiting a pattern that suggests a potential price decline. This analysis is based on both technical chart formations and the upcoming economic decisions from the Bank of England (BoE) and the Federal Reserve (Fed).
Trading Recommendations
While this analysis provides potential scenarios, remember that trading involves risk, and you should only trade with funds you can afford to lose. Here are two possible trading strategies based on different market outlooks:
- Bearish View (Expecting a Price Decrease):
- Action: Sell the GBP/USD pair.
- Take-Profit: Set a target to close your trade at a price of 1.2200.
- Stop-Loss: Set a price level to automatically close your trade at 1.2425 to limit potential losses.
- Timeframe: This strategy is intended to play out within 1-2 days.
- Bullish View (Expecting a Price Increase):
- Action: Buy the GBP/USD pair.
- Take-Profit: Set a target to close your trade at a price of 1.2425.
- Stop-Loss: Set a price level to automatically close your trade at 1.2200 to limit potential losses.
Market Context
The GBP/USD pair has been fluctuating, with recent movements influenced by a weaker US dollar. This week, attention has shifted from recent political events to upcoming policy announcements by the BoE and the Fed. The exchange rate is currently around 1.2330, which is up from recent lows.
Key Factors Affecting the Pair
- US Dollar Weakness: The recent rise in the GBP/USD pair is partly due to a weakening of the US dollar.
- Central Bank Decisions: Both the BoE and the Fed are expected to make key announcements soon regarding interest rates.
- Diverging Interest Rate Policies: There is a strong possibility that the BoE and the Fed will take different approaches on interest rates.
- UK Economic Data: Recent data indicates a drop in UK inflation and retail sales, leading many economists to expect the BoE to cut interest rates to stimulate the economy.
- US Inflation: While still high, US inflation is showing signs of stabilization, potentially leading the Fed to maintain its current higher interest rate policy.
Technical Analysis
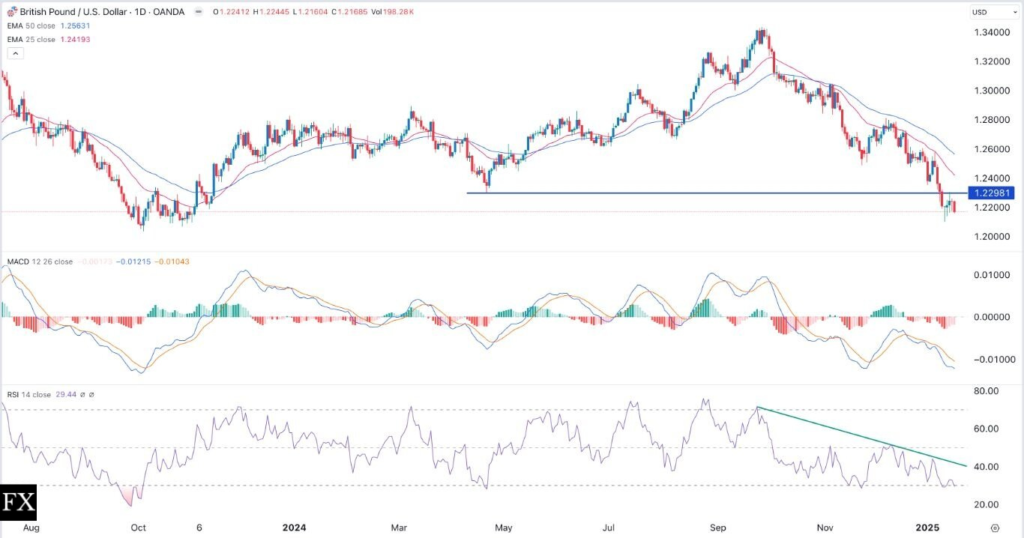
- Bearish Flag Pattern: On the four-hour chart, the GBP/USD pair appears to be forming a bearish flag pattern. This pattern often suggests a continuation of the downward trend.
- Ascending Channel: The price has risen in an ascending channel after a previous drop. The formation of this pattern supports the idea of the bearish flag.
- Key Support Level Break: The price has moved below a previous support level at 1.2352, further indicating potential weakness.
- Fading Uptrend: The Average Directional Index (ADX) suggests that the recent upward momentum has weakened.
- Potential Downward Target: Based on these technical factors, the price could potentially fall towards the lower part of the channel around 1.2225.
Conclusion
Based on the technical analysis and the expected divergence in central bank policies, the GBP/USD pair has a higher probability of moving downwards. However, the potential for a move in the opposite direction always exists. Always remember to manage your risk when trading and make decisions that align with your risk tolerance.
Ready to trade the GBP/USD Forex analysis? Check out the best forex trading company in UK worth using.